As search becomes increasingly mobile, getting closer to being the majority of search visits every month, how we think about user engagement on search results needs to be updated from the old desktop paradigms of the Golden Triangle (which suggest attention sticks to the upper left and decays down and to the right).
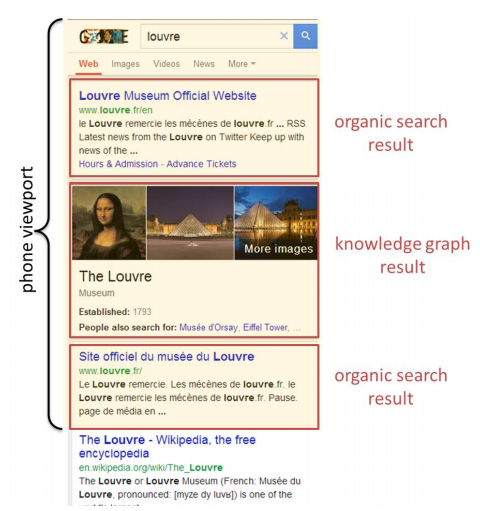
Mobile search use cases and device features change the way users distribute their attention on a search result page. Not only does this change CTR curves for mobile, and the relative value of each position, it also changes how search engines evaluate usage metrics and satisfaction. This is compounded by the presence of Knowledge Graph (entity results, panels, and carousels) and Instant Answers (weather, scores, etc.) which may satisfy a users query without logging a click or scroll.
Collecting Mobile Usage Data
Google conducted a study with Emory University to look at how gaze, viewport metrics, and page metrics correlate with each other and with relevance and satisfaction metrics. In particular, they looked at what could be inferred using viewport metrics.
User behavior was measured in 3 ways.
- Gaze Metrics – Traditional eye tracking, monitoring where the eye is looking and how much time it spends looking at it. In particular, tracking how the user looks at Knowledge Graph and Instant Answers that are both relevant and irrelevant. This can show a gaze distribution by ranking position.
- Viewport Metrics – The viewport is the visible portion of a webpage on the mobile device’s screen. This measures how long, in seconds, a feature on the page remains visible, including Knowledge Graph, Instant Answers, and a distribution by rank position.
- Page Metrics – This includes traditional analytics metrics, like time on page and number of scrolls. Additionally, a user’s satisfaction rating can be collected.
Their data is summarized in the table below:
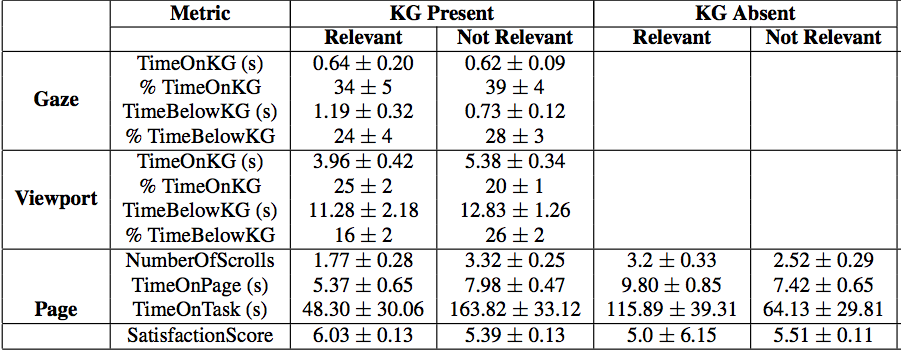
Comparing the differences highlights a few interesting takeaways.
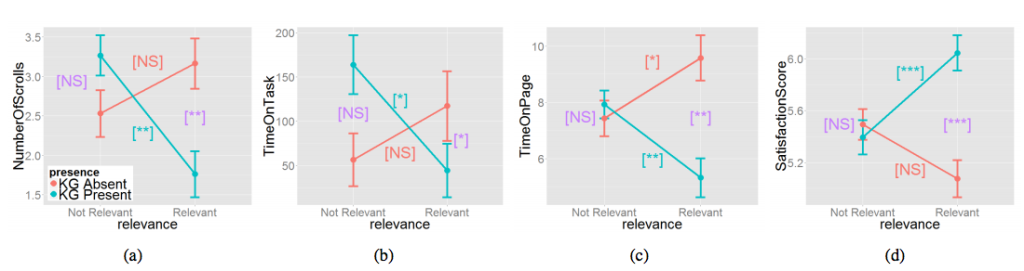 (Average values of NumberOfScrolls, TimeOnTask, TimeOnPage and SatisfactionScore for four experimental conditions with error bars indicating standard errors. Statistical significance of group pairwise comparisons is annotated using the following coding: NS – not significant, * – p-value<0.05, ** – p-value<0.01, *** – p-value<0.001)
Takeaways
- Users are more satisfied when answer-like results are present.
- Users are more satisfied when KG is relevant than when it is irrelevant.
- When KG was relevant, users quickly found the answer and completed the task faster, while when KG was irrelevant, they spent more time on the page looking for the answer.
- Relevant KG results were associated with less scrolling down the page.
- Users spend more viewport time and gaze time on KG results when they are irrelevant compared to when KG is relevant.
Effect of Knowledge Graph on Mobile Search
While some of these findings seem obvious, there are a few important points. First, data is showing that users’ intent is satisfied more often by Knowledge Graph, suggesting that answer-like features may become increasingly common. Second, Knowledge Graph is reducing the time spent by users reviewing different results, so there is a reduction in the breadth of sites getting visibility in mobile search results. Lastly, when relevant Knowledge Graph results are present, users scroll less, increasing the value of higher rankings and reducing the visibility of and traffic to lower ranked results.
As seen below, the Knowledge Graph attracts a significant amount of attention on mobile search, and, in instances where the result is relevant, it significantly reduces the visibility of results lower on the page.
![]()
Similar behavior was seen on Instant Answer results.
Additionally, one of the most important takeaways is that viewport metrics can be related to searchers’ satisfaction. This means that for mobile search, information from the phone’s viewport can be used to infer users’ satisfaction, and therefore be leveraged as a ranking signal to adjust search results.
Click Through and Attention Curves for Mobile Search
This data also provides a better understanding of user click and gaze behaviors on mobile search results, which are summarized below.
![]()
On mobile devices, rank positions 2 and 3 have increased user attention, more than any other rank, even rank number 1. This is true for both time in the viewport (amount of time the results is on the screen) and for gaze time (amount of time the user is looking at a particular result).
This means the historical model of the golden triangle on desktop search does not apply on mobile devices. Unlike desktop SERPs, where users might jump from one page fold to another, users often tend to perform short scrolls that may render the second or third result visible across more viewports and for longer time than the first result.
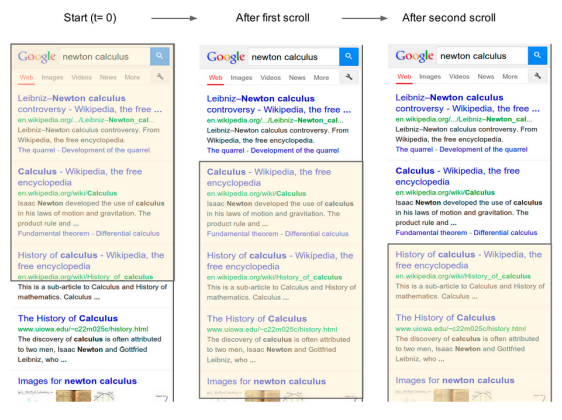
In traditional desktop search, engagement is focused on the top-left and decreases as the user moves to the bottom or to the right, but this is not true on mobile.
![]()
On mobile devices, it seems that, on average, user attention is focused on the center and top half of the mobile screen. On average, 68% of attention is given to the top 1/2 of the screen and 86% of attention is given to the top 2/3 of the screen.
Correlating The Data
Additionally, strong correlations were found between user satisfaction ratings, gaze data, and viewport data. This means that viewport data could be used to infer gaze and user satisfaction.
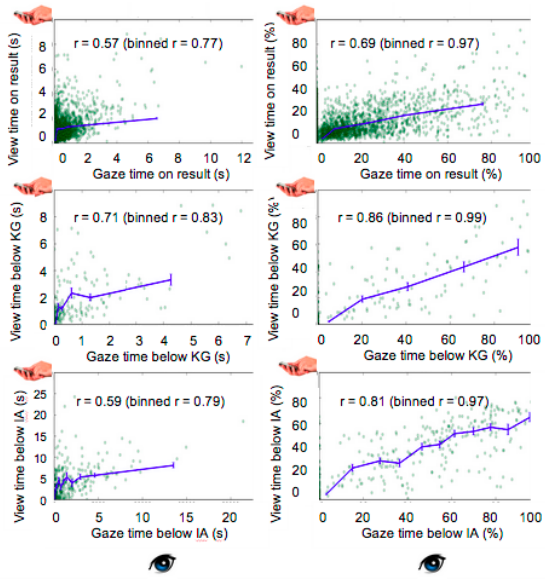
These correlations are reasonably strong. This means Google could use viewport data to confidently infer what result position the user is looking at, even without using gaze, mouse hover, or click data. This allows them to potentially implement a factor like this at scale, leveraging user behavior data on mobile devices to evaluate rankings.
Google has increasingly integrated user metrics into their ranking factors, such as pogosticking, bounces, and click-through-rates. Viewport and page metrics may increasing help reorder search results in mobile search.
Tactical Takeaways
In addition to changing how we think about results, this data highlights a few areas tactically.
- High rankings are becoming increasingly important as search becomes increasingly mobile.
- Rank number one is not always best. In mobile, rank 2 or 3 could out perform rank 1.
- Knowledge Graph is an increasing threat for businesses that leverage Google for website traffic, especially for those ranking below rank 5 in mobile search.
- Having a mobile-friendly site is increasingly important so your result doesn’t get a demotion for not being mobile-friendly. Considering the attention distribution on mobile, you can’t afford to give up a few spots in mobile.
- Capturing attention is vital, and renewed effort should be placed on titles and meta descriptions to improve CTR. Because of the distraction of KG, you have less of a chance to convince a user to click through to your site, so your SERP listings need to be on point.
- SERP listings (title and description) are increasingly important for drawing the eye away from the Knowledge Graph or Instant Answers.
- Eliciting disproportionate engagement at lower rankings may help you improve your rankings as user data like viewport and page metrics are used to evaluate the relevance of a search result.
- Branding, retention, reputation and an engaging SERP listing are becoming increasingly important ranking factors, as these psychological factors will influence how a user engages with your listing and brand in search results.